function(countries) {
var list = countries.list[0];
that.list = [];
list.items.forEach(function(element){
var normalValue =  element.normalValue.split(/-/);
var lower = parseFloat(normalValue[0]);
var upper = parseFloat(normalValue[1]);
var bgColor;
if(element.value >= lower && element.value <= upper){
bgColor ="normal";}else{
bgColor ="abnormal";
}
that.list.push(
{
itemName:element.itemName,
value:Math.round(element.value *100) /100 ,
unit:element.unit,
bgColor:bgColor
}
);
});
まず、上記のリスト配列を、下記のものに差し替える。function(countries) {
// 直近の検査日の検査結果を変数 list に格納
var list = countries.list[0];
// 検査グループ配列を空配列に初期化
that.group = [];
// 個々の検査グループを格納するための一変数を null で初期化
var group = null;
// 検査結果項目配列 list.items の個々の要素 element に対してループ処理
list.items.forEach(function(element){
// elementが一番最初の検査結果項目の場合、groupを初期化する
if(group == null) {
group = {
'groupName': element.groupName,
'items': []
};
// 検査グループが変わったとき、groupを検査グループ配列に追加してからgroupを初期化する
} else if(group.groupName != element.groupName){
that.group.push(group);
group = {
'groupName': element.groupName,
'items': []
};
}
// 基準値を求めて normalValue 変数に格納する
var normalValue = getNormalValueRange(element.normalValue);
// 基準値と検査結果を比較して背景色を決める
var bgColor;
if(element.value >= normalValue.lower && element.value <= normalValue.upper){
bgColor ="normal";}else{
bgColor ="abnormal";
}
// グループに検査結果を追加する
group.items.push(
{
'itemName': element.itemName,
'value': round(element.value), // 四捨五入
'unit': element.unit,
'bgColor': bgColor,
}
);
});
// 最後のgroupを検査グループ配列に追加する
if(group != null) {
that.group.push(group);
}
}
);
また、getNormalValueRange関数およびround関数の定義を以下の様に行った。/*
基準値の下限と上限を求める
*/
function getNormalValueRange(normalValue) {
var normalValue = normalValue.split(/-/);
var lower = parseFloat(normalValue[0]);
var upper = parseFloat(normalValue[1]);
return {
lower: lower,
upper: upper,
};
}
/*
四捨五入(小数第3位)
*/
function round(value) {
return Math.round(value * 100) / 100;
}
jsのグループ対応付けが完了したところで、次にHTMLの編集を行う。<ons-list>
<ons-list-item class="{{country.bgColor}}" ng-click="countries.showCountry(country.itemName)" modifier="chevron" ng-repeat="country in countries.list | filter:query">
<ons-col width="50%">{{ country.itemName }}</ons-col>
<ons-col>{{country.value}}</ons-col>
<ons-col>{{country.unit}}</ons-col>
</ons-list-item>
</ons-list>
HTMLのこの記述を、以前のブログのコメントに記載されていたこの形式に書き換えた。<ons-list ng-repeat="group in countries.group">
<ons-list-header>{{ group.groupName }}</ons-list-header>
<ons-list-item class="{{country.bgColor}}" ng-click="countries.showCountry(country.itemName)" modifier="chevron" ng-repeat="country in group.items | filter:query">
<ons-col width="65%">{{ country.itemName }}</ons-col>
<ons-col>{{ country.value }}{{ country.unit }}</ons-col>
</ons-list-item>
</ons-list>
上記の書き換えを行った後、スマートフォンで確認したところ、以下の図1の様な結果が表示された。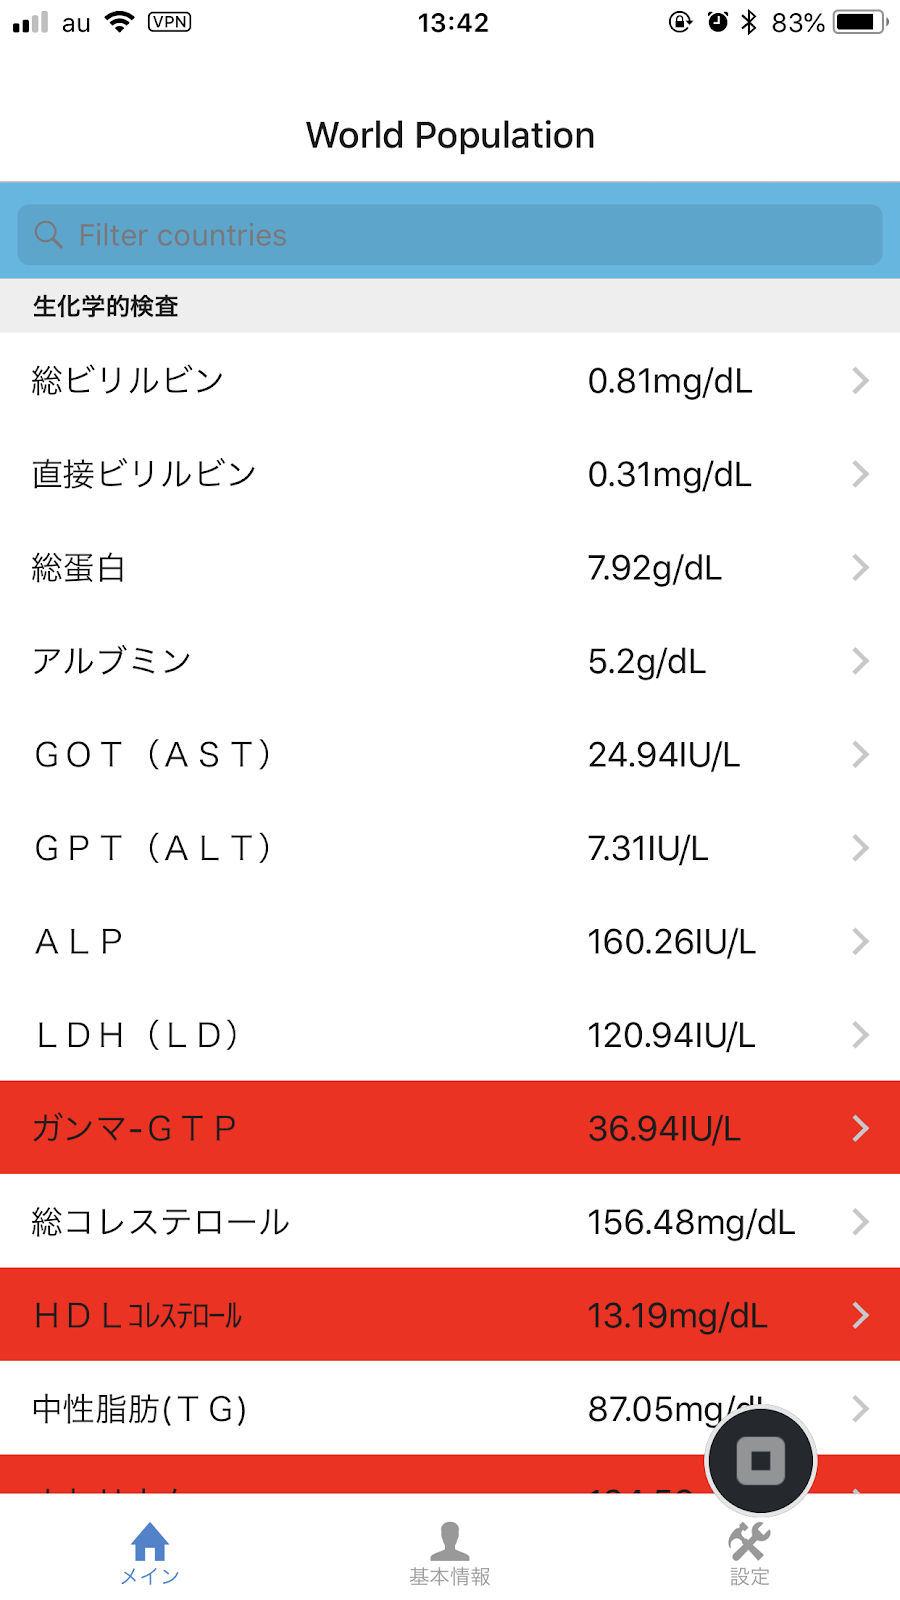 |
| 図1 グルーピング処理を行った後の画面 |
こうして、なんとかグループごとに検査項目の表示を行う事が出来た。
次回は過去の検査データの表示が行えるような処理を行っていきたい。
【コメント】
検査項目のグルーピングができました。過去の検査データは 配列countries.listの中に入っています。だから、3行目の
var list = countries.list[0];で、指定した日付に対応する配列要素を取り出せばよいでしょう(この場合は先頭の配列要素を取り出しているので直近の検査結果になっています)。やってみてください。
その前に、図1に表示された検査グループ名称「生化学的検査」ですが、デフォルトの表示だと控えめすぎるので、もっと存在感を出した方が良いように思います。 例えばCARADA健診手帳のような画面を参考にしてCSSを使って画面をデザインしてはどうでしょう?


0 件のコメント:
コメントを投稿