作業内容は
- 患者基本情報項目の洗い出し・デザイン
- 患者基本情報データの取得
- 患者基本情報表示画面の作成
- 検査結果表示の修正・作成
である。
4人で話し合い、作業分担を決めた後、各自スケジュール表(WBS)を作成した。
そして、完成目標が10月20日(土)のオープンキャンパス展示となったため、それまでの完成を目指す。
.controller('PopulationChartController', ['$scope', function($scope) {
  $scope.formatData = function() {
    if (!$scope.data) {
      return [];
    }
    //alert(JSON.stringify($scope.data,null,2));
    var total = [],
      males = [],
      females =[];

$scope.data.forEach(function(item){
  var strDate = item.sampleDate.replace(/ /g, ' 02:');
  var sampleDate = Date.parse(strDate.replace(/-/g, '/'));
  var value = parseFloat(item.value);
  var normalValue = item.normalValue.split(/-/);
  var lower = parseFloat(normalValue[0]);
  var upper = parseFloat(normalValue[1]);


      total.push({x: sampleDate, y: upper});
      males.push({x: sampleDate, y: value});
      females.push({x: sampleDate, y: lower});
    });

    return [
      {
        key: '上限',
        values: total
      },
      {
        key: '下限',
        values: females
      },
      {
        key: '検査結果',
        values: males
      }
    ];
  };
.controller('PopulationChartController', ['$scope', function($scope) {
  $scope.formatData = function() {
    if (!$scope.data) {
      return [];
    }
    //alert(JSON.stringify($scope.data,null,2));
    var total = [],
      males = [],
      females =[];

$scope.data.forEach(function(item){
  var strDate = item.sampleDate.replace(/ /g, ' 02:');
  var sampleDate = Date.parse(strDate.replace(/-/g, '/'));
  var value = parseFloat(item.value);
  var normalValue = item.normalValue.split(/-/);
  var lower = parseFloat(normalValue[0]);
  var upper = parseFloat(normalValue[1]);


      total.push({x: sampleDate, y: upper});
      males.push({x: sampleDate, y: value});
      females.push({x: sampleDate, y: lower});
    });

    return [
      {
        key: '上限',
        values: total,
        color: '#0000CC',
        area:true
      },
      {
        key: '下限',
        values: females,
        color: '#FF0000',
        area:true
      },
      {
        key: '検査結果',
        values: males,
        color: '#00FF00',
        strokeWidth:4
      }
    ];
  };
 |
| 図1 グラフに色を付けて表示した結果 |
 |
| 図2 線の太さとエリアの色付けをして表示した結果 |
<ons-tabbar>
  <ons-tab label="Tab 1" icon="ion-***"active></ons-tab>
  <ons-tab label="Tab 2" icon="ion-***"></ons-tab>
</ons-tabbar>
上記のコーディングはタブバーの定義である。
<ons-navigator var="navi" page="tab.html"></ons-navigator>まず、上記htmlの「ons-navigator」の直下に追加していく。また、ナビゲータがデフォルト表示する「page」をこれから定義する「tab.html」へ変更しておく
<ons-template id="tab.html">
        <ons-page>
          <ons-tabbar>
            <ons-tab page="main.html" label="メイン" icon="ion-home"active>
            </ons-tab>
            <ons-tab page="demographics.html" label="基本情報" icon="ion-person">
            </ons-tab>
            <ons-tab page="settings.html" label="設定" icon="ion-settings">
            </ons-tab>
          </ons-tabbar>
        </ons-page>
     </ons-template>
まず、1行目の「ons-template」でこのタブバーを「tab.html」として定義し、,2行目で「ons-page」の定義を行う。 |
| 図3 タブバーの追加を行った結果 |
 |
| 図4MONACAアプリの新規ファイル作成画面 |
<ons-page>
  <ons-toolbar>
    <div class="center">基本情報</div>
  </ons-toolbar>
</ons-page>
上記のプログラムを記入した後、スマホで確認をすると、 |
| 図5 基本情報タブをタップした結果 |
Countries.get()
    .then(
      function(countries) {
        var list = countries.list[0];
        that.list = [];
        list.items.forEach(function(element){
          that.list.push(
              {
                itemName:element.itemName,
                value:element.value,
                unit:element.unit
              }
            );
        });
      }
    );
これは、前回コーディングしたプログラムである。10行目が、検査結果を連想記憶に設定しているところであるが、これを以下のように書き換える。value:Math.round(element.value *100) /100Math.roundは、javascriptで四捨五入を行うときに使う関数であるが,この関数は小数点以下1桁目を四捨五入して整数を返す関数である。小数点以下3桁目を四捨五入するために,まず検査値を100倍にし、それをMath.round関数を使って四捨五入する。その結果を100で割ると、小数点以下3桁目を四捨五入した結果が得られる。
 |
| 図1 検査結果を小数点以下第2位まで表示した結果 |
Countries.get()
    .then(
      function(countries) {
        var list = countries.list[0];
        that.list = [];
        list.items.forEach(function(element){
          that.list.push(
              {
                itemName:element.itemName,
                value:Math.round(element.value *100) /100
                unit:element.unit
              }
            );
        });
      }
    );
まず先ほども修正した上記javascriptのプログラムを以下のように書き換える。Countries.get()
.then(
function(countries) {
var list = countries.list[0];
that.list = [];
list.items.forEach(function(element){
var normalValue = element.normalValue.split(/-/);
var lower = parseFloat(normalValue[0]);
var upper = parseFloat(normalValue[1]);
var bgColor;
if(element.value >= lower && element.value <= upper){
bgColor ="normal";
}else{
bgColor ="abnormal";
}
that.list.push(
{
itemName:element.itemName,
value:Math.round(element.value *100) /100 ,
unit:element.unit,
bgColor:bgColor
}
);
});
}
);
まず、条件判定を行うにあたって、基準値から上限・下限の取りだしを行う必要があるのだが、これは以前のブログに書いたプログラムを流用し、7~9行目のように記入する。尚、7行目に関しては、今回検査データはelementに格納されているため、element.normalValueへ変更した。次に、10行目に背景を表すクラス属性を格納する変数を「bgColor」として定義する。そして、11行目~15行目にif文を使って条件判断を記述する。内容は「検査値(element.value)が下限値(lower)以上かつ、上限値(upper)以下であれば正常(normal),そうでなければ異常(abnormal)」といったものである。最後に、that.list.pushで追加する連想配列の21行目にbgColor:bgColorと記載することで、クラス属性を表すbgColorの設定を行った。<ons-list>
<ons-list-item class="{{country.bgColor}}"
ng-click="countries.showCountry(country.itemName)" modifier="chevron"
ng-repeat="country in countries.list | filter:query">
<ons-col width="50%">{{ country.itemName }}</ons-col>
<ons-col>{{country.value}}</ons-col>
<ons-col>{{country.unit}}</ons-col>
</ons-list-item>
</ons-list>
そしてhtmlの2行目にある「ons-list-item」タグに「class="{{country.bgColor}}" 」を記述することで、javascriptで設定したクラス属性値("normal"または"abnormal")を設定することができる。 |
| 図2検査結果一覧画面で異常値に色を付けた結果 |
Countries.get()
    .then(
      function(countries) {
        var list = countries.list[0];
        that.list = [];
        list.items.forEach(function(element){
          that.list.push(element.itemName);
        });
      }
    );
上記のコードは以前のブログで記述したcountries.list配列に検査名を格納する処理であるが、このコード6行目以降を下記の様に変更する。list.items.forEach(function(element){
that.list.push(
{
itemName:element.itemName,
value:element.value,
unit:element.unit
}
);
以前のブログで調べた検査―データ中にある検査名、検査値、単位それぞれに対応する値をpushメソッドを利用してthat.list配列の中に格納する。javascriptでは、この様なディクショナリ形式(連想配列)で関連する一塊のデータをまとめて記述できる。<ons-list>
<ons-list-item ng-click="countries.showCountry(country)" modifier="chevron"
ng-repeat="country in countries.list | filter:query">
{{ country }}
</ons-list-item>
4行目の{{country}}はcounties.listから取り出した要素データを表示するものだが、これを下記の様に書き換える。{{ country.itemName }}
{{ country.value}}
{{ country.unit}}
この様にcountry.検査名(itemName),検査値(value),単位(unit)と記述することで、対応したデータを表示することが出来る。 |
| 図1 検査項目一覧画面 |
<ons-col>{{ country.itemName }}</ons-col>
<ons-col>{{country.value}}</ons-col>
<ons-col>{{country.unit}}</ons-col>
<ons-col>はonsen-UI上で列を表示するタグである。 |
| 図2 ons-colタグで整形した検査項目一覧画面 |
<ons-col width="60%">{{ country.itemName }}</ons-col>
<ons-col>{{country.value}}</ons-col>
<ons-col>{{country.unit}}</ons-col>
1行目にwidthを記述することで幅の調節を行う事が出来る。 |
| 図3 width属性で幅の調整を行った検査項目一覧画面 |
<ons-list-item class="normal" ng-click="countries.showCountry(country.itemName)...
<ons-list-item class="abnormal" ng-click="countries.showCountry(country.itemName)...まず、htmlの「ons-list-item」タグへ「normal」「abnormal」というclassの値を設定する。
.abnormal {
    background-color: #FF0000;
}

.normal{
   background-color: #FFFFFF;
}
上記の記述はそれぞれ「abnormal」であれば背景を赤、「normal」であれば背景を白にするといった定義である。さらに健康志向の個人の増加に伴い,個人が常に携帯しているスマートフォンなどを利用して日々の運動量,心拍数,食事量,睡眠状態などの多種多様な項目を測定して管理できるアプリケーションが提供され始めている。さらに
現段階では,これらのアプリケーションはスタンドアローンで動作しており,アプリケーション同士や特定健診システムや保健指導システムとの連携は取れていない。 しかし将来的には,アプリケーションが連動して日々健康指導を密に行うようなことが望まれる。このようなデータも含めた個人の生涯にわたる健康情報を管理し解析することで,個人に最適な快適で効果が高く効率的な健康指導が可能になると期待される。と続く。
nv.addGraph(function() {
    chart = nv.models.stackedAreaChart()
    .useInteractiveGuideline(true)
    .showControls(false)
    .margin({left: 50, right: 30});
上記のコードはNVD3を用いたグラフ描画の方法なのだが、これを以下のコードに書き換えるnv.addGraph(function() {
chart = nv.models.lineChart()
.useInteractiveGuideline(true)
.showControls(false)
.margin({left: 50, right: 30});
2行目の「chart = nv.models.lineChart()」という記述を用いることで折れ線グラフの描画を行う事が出来る。しかし、この状態でアプリケーションを実行すると、エラーが表示され、グラフの描画を行う事が出来ない。3~5行目の.から始まる記述はメソッドを示しているのだが、いずれかのメソッドがlineChartのメソッドではないものが記述されている為、エラーが表示されてしまう。ここで、一つ一つのメソッドに対してコメントアウトを行い、どのメソッドがlineChartのものではないのか検証したところ、4行目の「.showControls(false)」といったメソッド(グループモードと積み上げモードを切り替える)がlineChartのメソッドではなかったので、このメソッドをコメントアウトしたところ、折れ線グラフでの描画を行う事が出来た。chart.xAxis
.tickFormat(d3.format(',r'));
この「chart.xAxis」というものは、グラフのx軸を示しているものである。2行目の「.tickFormat」というものは目盛の形式を示しており、(,r)のrは数字という意味であり、カンマは数字に3桁ごとにカンマを付与するといったものである。chart.xAxis
.tickFormat(
function(d) {
return d3.time.format('%Y-%m-%d')(new Date(d));
}
);
上記のxAxisのtickFormatメソッドは、変数dを通じて渡されてきた座標目盛りの値を、無名関数を使って任意の形式に編集している。ここでは基準日時からの経過秒が格納されている数値変数dをnew Date(d)によってJavascriptの日付オブジェクトに変換し、それをd3.time.format関数を使って書式'%Y-%m-%d'により「YYYY-MM-DD」の形式に編集している。 |
| 図1 x軸の目盛りを日付にしたグラフ画面 |
chart.yAxis
.tickFormat(function(d) {
if ((d / 1000000) >= 1) {
d = Math.round(d / 100000) / 10 + 'M';
}
else if ((d / 1000) >= 1) {
d = Math.round(d / 100) / 10 + 'K';
}
return d;
});
これは1,000,000や、1,000等の値の大きい数をそれぞれ、MやKの単位をつけて短くするものであるが、今回扱うデータはあまり大きい値ではないので、この部分をコメントアウトする。chart.yAxis
.tickFormat(function(d) {
/* if ((d / 1000000) >= 1) {
d = Math.round(d / 100000) / 10 + 'M';
}
else if ((d / 1000) >= 1) {
d = Math.round(d / 100) / 10 + 'K';
}*/
return d + scope.data[0].unit;
});
9行目の「d + scope.data[0].unit;」という記述でグラフのy軸の数値に検査単位を付与することが出来る。ここで、scope.dataは、PopulationChartディレクティブのビューであるHTML中のpopulation-chartタグに付与されたdata属性を表している(下記)。<population-chart ng-if="country.showChart" data="country.population"></population-chart>このcountry.populationにはPopulationサービスで作成した検査項目の時系列データが配列として格納されており、その直近の検査日の結果scope.data[0]の検査単位であるscope.data[0].unitを使用してy軸の目盛りに単位をつけている。
.yDomain([2 * lower-upper, 2 * upper-lower])ここで、「lower」は基準値の下限、「upper」は基準値の上限である。
var normalValue = scope.data[0].normalValue.split(/-/); var lower = parseFloat(normalValue[0]); var upper = parseFloat(normalValue[1]);直近の検査項目の情報はscope.data[0]に入っているので、そこから基準値scope.data[0].normalValueを取り出し、それを区切り文字「-」で分割し、先頭要素を下限値、2番目の要素を上限値として実数に変換する。これにより、下記の図2の様にグラフのy軸の最大値と最小値の設定を行う事ができ、正常値範囲がわかりやすくなった。
 |
| 図2 基準値範囲を見やすくしたグラフ画面 |
.controller('PopulationChartController', ['$scope', function($scope) {
$scope.formatData = function() {
if (!$scope.data) {
return [];
}
alert(JSON.stringify($scope.data,null,2));
var total = [],
males = [],
females =[];
for (var i = 0; i < $scope.data.length; i++) {
var data = $scope.data[i];
total.push({x: data.age, y: data.total});
males.push({x: data.age, y: data.males});
females.push({x: data.age, y: data.females});
}
まず、Javascriptの上記「poplationchartController」の12行目からのプログラムを以下のものに書き換える。$scope.data.forEach(function(item){
var strDate = item.sampleDate.replace(/ /g, ' 02:');
var sampleDate =Date.parse(strDate.replace(/-/g, '/'));
var value =parseFloat(item.value);
var normalValue = item.normalValue.split(/-/);
var lower = parseFloat(normalValue[0]);
var upper = parseFloat(normalValue[1]);
total.push({x: sampleDate, y: upper});
males.push({x: sampleDate, y: value});
females.push({x: sampleDate, y: lower});
});
return [
{
key: '上限',
values: total
},
{
key: '下限',
values: females
},
{
key: '検査結果',
values: males
}
];
};
OpenDolphinから取得した検査結果は以前のブログに書いたように次のようなフォーマットをしている。{
"list": [
{
"progressState": null,
"items": [
{
"laboCode": null,
"lipemia": null,
"hemolysis": null,
"dialysis": null,
"reportStatus": "E",
"groupCode": "01",
"groupName": "生化学的検査",
"parentCode": "0001",
"medisCode": "3J010000002327101",
"itemName": "総ビリルビン",
"abnormalFlg": null,
"normalValue": "0.2-1.2",
"specimenCode": "023",
"specimenName": "血清",
"commentCode1": null,
"comment1": null,
"commentCode2": null,
"comment2": null,
"sortKey": null,
"itemCode": "0001",
"sampleDate": "2018-05-06 00:00",
"patientId": "1.3.6.1.4.1.9414.70.1:00001",
"unit": "mg/dL",
"value": "0.4",
"id": 1120
},
・
・
・
(中略)
・
・
・
{
"laboCode": null,
"lipemia": null,
"hemolysis": null,
"dialysis": null,
"reportStatus": "E",
"groupCode": "07",
"groupName": "一般検査",
"parentCode": "0493",
"medisCode": "1B040130201506211",
"itemName": "便中ヒトヘモ定性2日目",
"abnormalFlg": null,
"normalValue": "陰性",
"specimenCode": "015",
"specimenName": "便",
"commentCode1": null,
"comment1": null,
"commentCode2": null,
"comment2": null,
"sortKey": null,
"itemCode": "0493",
"sampleDate": "2018-05-04 00:00",
"patientId": "1.3.6.1.4.1.9414.70.1:00001",
"unit": null,
"value": "インセイ",
"id": 1084
}
],
"sampleDate": "2018-05-04 00:00",
"laboCenterCode": "LSCC",
"moduleKey": "LSCC2018050442011",
"reportFormat": null,
"patientName": "山下 浩介",
"patientSex": "M",
"numOfItems": null,
"patientId": "1.3.6.1.4.1.9414.70.1:00001",
"id": 1051
}
]
}
この中で、検査日時はsampleDateで、「2018-06-06 00:00」という形式になっている。Javascriptで日時として認識されるデータは「2018/06/06 00:00:00」という形式なので、これを正規表現を使って適切な書式に書き換える。var strDate = item.sampleDate.replace(/ /g, ' 02:');まず、「strDate」という変数を定義し、検査日時item.sampleDate中のスペースを「 02:」に置き換える。これにより、元の時刻「00:00」を「02:00:00」という時分秒の形式に置き換えることができる。なお、「02:00:00」は午前2時0分0秒を意味するが、この時間には意味がない。「01:00:00」でも何でもよかった。
var sampleDate =Date.parse(strDate.replace(/-/g, '/'));次に、strDate.replace(/-/g, '/')で「strDate」の中の「-」を「/」へ置き換えて、日付「2018-06-06」を「2018/06/06」という形式に変換し、「Date.parse」という命令により文字列の日時をJavascriptの日時オブジェクトに変換する(Javascriptの日付オブジェクトは基準日時からの経過秒で表現されている)。これらの置き換え作業によって、検査日時を変数「sampleDate」に設定できた。
var value =parseFloat(item.value);これは、検査値「item.value」を「paresFloat」命令で文字列から実数値に変換し、変数「value」に代入しているところである。
var normalValue = item.normalValue.split(/-/);これは「item.normalValue」に入っている検査の基準値を上限と下限に分離して、それぞれ変数「upper」と「lower」に格納する処理である。item.normalValueの中に格納されている値は「0-10」という書式になっているので、「-」を区切り文字として、「-」の前後で数字を分ける。例えば、「0.2-1.2」という値であれば、「0.2」と「1.2」の二つの値に分け、それぞれを下限値、上限値とする。
var lower = parseFloat(normalValue[0]);
var upper = parseFloat(normalValue[1]);
total.push({x: sampleDate, y: upper});
males.push({x: sampleDate, y: value});
females.push({x: sampleDate, y: lower});
 |
| 図1 検査結果グラフ |
.service('Population', ['$http', function($http) {
this.get = function(country, year) {
return $http.jsonp('http://api.population.io:80/1.0/population/' + year + '/' + country + '/?format=jsonp&callback=JSON_CALLBACK')
.then(
function(response) {
return response.data;
}
);
};
}])
まず上記のコードを下記のコードに書き換える。.service('Population', ['$http', function($http) {
this.get = function(country, year) {
return $http.get('http://172.16.108.251:8080/dolphin/openSource/lab/module/00001,0,6')
.then(
function(response) {
alert(JSON.stringify(response.data,null,2));
return response.data;
}
);
};
}])
これは「$http」サービスを使ってOpenDolphinから検査データを取得するサービスPopulationである。また、確認の為6行目に、タップした際に検査データをアラートで表示する処理を加えている。編集を行った後、検査項目をタップすると、前回と同様の画面が表示された。.service('Population', ['$http', function($http) {
this.get = function(country, year) {
return $http.get('http://172.16.108.251:8080/dolphin/openSource/lab/module/00001,0,6')
.then(
function(response) {
//alert(JSON.stringify(response.data,null,2));
var laboResults = [];
response.data.list.forEach(function(list){
list.items.forEach(function(item){
if(item.itemName == country){
laboResults.push(item);
}
});
});
alert(JSON.stringify(laboResults,null,2));
return laboResults;
}
);
};
}])
次に、先ほどのコードを上記のコードに書き換える。 |
| 図1 MONACAアプリ画面 |
 |
| 図1 notepad++図1 |
GET /dolphin/openSource/lab/module/00001,0,6は検査データを最新から過去6日分までの取得を行う指示である。OpenDolphinで過去6日分ごとしかデータを表示することが出来なかったのはこのためであろう。
 |
| 図2 notepad++図2 |
 |
| 図3 notepad++図3 |
 |
| 図4 ハッシュ計算ツール図 |
.config(['$httpProvider',function($httpProvider){
$httpProvider.defaults.headers.common.password='6f8e646f95af8e79096477e877245664';
$httpProvider.defaults.headers.common.userName='1.3.6.1.4.1.9414.70.1:W3415020';
}])
を追加する。これは「$httpProvider」というAngularJS組み込みサービスを用いたものである。このサービスは同じくAngularJSの組み込みサービスである「$http」のデフォルトの動作を変更するために用いるサービスである。ここでは、「headers」属性を使って、HTTPリクエストのヘッダーにパスワードとユーザネームを書き込む処理を行っている。.service('Countries', ['$http', function($http) {
this.get = function() {
return $http.get('countries.json')
.then(
function(response) {
return response.data.countries;
}
);
};
}])
これは国一覧のデータを取得し、リストへ送るサービスであるが、これを.service('Countries', ['$http', function($http) {
this.get = function() {
return $http.get('http://172.16.108.251:8080/dolphin/openSource/lab/module/00001,0,6')
.then(
function(response) {
alert(JSON.stringify(response.data.list[0],null,2));
return response.data;
}
);
};
}])
の様に書き換える。 |
| 図5 スマートフォンアプリ図1 |
Countries.get()
.then(
function(countries) {
that.list = countries;
}
);
上記は、取得した国名をリストに送るといったコードであるが、これを下記のコードに書き換える。Countries.get()
.then(
function(countries) {
var list = countries.list[0];
that.list = [];
list.items.forEach(function(element){
that.list.push(element.itemName);
});
}
);
まず、4行目の記述で、ローカル変数「list」に「countries.list」に格納されている検査データのうち最新のものを代入し、5行目で、検査一覧を格納する属性「that.list」を空配列に初期化する。 |
| 図6 スマートフォンアプリ図2 |
<ons-template id="country.html">
<ons-page ng-controller="CountryController as country">
<ons-toolbar>
<div class="left"><ons-back-button>Back</ons-back-button></div>
<div class="center">{{ country.name }}</div>
</ons-toolbar>
<ons-list class="year-select-container">
<ons-list-item>
<select
ng-model="country.year"
ng-options="year for year in country.years"
class="text-input text-input--transparent"
style="width: 100%; margin-top: 4px">
</select>
</ons-list-item>
</ons-list>
<population-chart ng-if="country.showChart" data="country.population"></population-chart>
</ons-page>
</ons-template>
angular.module('app', ['onsen'])
.controller('CountriesController', ['$scope', 'Countries', function($scope, Countries) {
var that = this;
Countries.get()
.then(
function(countries) {
that.list = countries;
}
);
this.showCountry = function(country) {
//$scope.navi.pushPage('country.html', {data: {name: country}});
navi.pushPage('country.html', {data: {name: country}});
};
}])
.controller('CountryController', ['$scope', 'Population', function($scope, Population) {
var that = this;
this.name = $scope.navi.topPage.data.name;
this.showChart = false;
$scope.navi.on('postpush', function() {
$scope.$evalAsync(function() {
that.showChart = true;
});
$scope.navi.off('postpush');
});
var currentYear = (new Date()).getUTCFullYear();
this.year = currentYear + '';
this.years = [];
for (var i = 1950; i <= 2100; i++) {
this.years.push('' + i);
}
this.getPopulation = function() {
Population.get(this.name, this.year)
.then(
function(population) {
that.population = population;
}
);
};
$scope.$watch('country.year', function() {
that.getPopulation();
});
}])
.service('Countries', ['$http', function($http) {
this.get = function() {
return $http.get('countries.json')
.then(
function(response) {
return response.data.countries;
}
);
};
}])
.service('Population', ['$http', function($http) {
this.get = function(country, year) {
return $http.jsonp('http://api.population.io:80/1.0/population/' + year + '/' + country + '/?format=jsonp&callback=JSON_CALLBACK')
.then(
function(response) {
return response.data;
}
);
};
}])
.factory('nv', function() {
return nv;
})
.factory('d3', function() {
return d3;
})
.controller('PopulationChartController', ['$scope', function($scope) {
$scope.formatData = function() {
if (!$scope.data) {
return [];
}
var total = [],
males = [],
females =[];
for (var i = 0; i < $scope.data.length; i++) {
var data = $scope.data[i];
total.push({x: data.age, y: data.total});
males.push({x: data.age, y: data.males});
females.push({x: data.age, y: data.females});
}
return [
{
key: 'Total',
values: total
},
{
key: 'Women',
values: females
},
{
key: 'Men',
values: males
}
];
};
$scope.$on('chartloaded', function(event) {
event.stopPropagation();
$scope.updateChart($scope.formatData());
$scope.$watch('data', function() {
if ($scope.data) {
$scope.updateChart($scope.formatData());
}
});
});
}])
.directive('populationChart', ['nv', 'd3', function(nv, d3) {
return {
restrict: 'E',
scope: {
data: '='
},
controller: 'PopulationChartController',
link: function(scope, element, attrs) {
var svg = document.createElementNS('http://www.w3.org/2000/svg', 'svg');
element.append(svg);
var chart;
scope.updateChart = function(data) {
d3.select(svg)
.datum(data)
.call(chart);
};
nv.addGraph(function() {
chart = nv.models.stackedAreaChart()
.useInteractiveGuideline(true)
.showControls(false)
.margin({left: 50, right: 30});
chart.xAxis
  .tickFormat(d3.format(',r'));
chart.yAxis
  .tickFormat(function(d) {
    if ((d / 1000000) >= 1) {
      d = Math.round(d / 100000) / 10 + 'M';
    }
    else if ((d / 1000) >= 1) {
      d = Math.round(d / 100) / 10 + 'K';
    }
    return d;
  });
nv.utils.windowResize(function() {
chart.update();
});
scope.$emit('chartloaded');
return chart;
});
}
}
}]);
19行目~52行目はコントローラCountryControllerの定義である。先に見た西暦年選択ボックス作成のために必要となるデータが定義されている。32行目でcurrentYearに現時点の西暦年を4桁で設定している。<link href="https://cdn.rawgit.com/novus/nvd3/v1.8.1/build/nv.d3.css" rel="stylesheet" type="text/css">
<body>
<div id="chart">
<svg style="height:500px;" />
</div>
<script src="https://d3js.org/d3.v3.min.js"></script>
<script src="https://cdn.rawgit.com/novus/nvd3/v1.8.1/build/nv.d3.js"></script>
<script type="text/javascript">
nv.addGraph(function() {
//var chart = nv.models.historicalBarChart();
//var chart = nv.models.lineWithFocusChart();
var chart = nv.models.lineChart();
chart.xAxis.tickFormat(d3.format(',f'));
chart.yAxis.tickFormat(d3.format(',.2f'));
d3.select('#chart svg')
.datum(testData())
.transition().duration(500)
.call(chart);
nv.utils.windowResize(chart.update);
return chart;
});
function testData() {
return [{color:'red',
key:'hoge',
values: [{x:1,y:100},
{x:2,y:130},
{x:3,y:90},]},
{color:'blue',
key:'hage',
values: [{x:1,y:70},
{x:2,y:60},
{x:3,y:80},
{x:4,y:90}]}];
}
</script>
</body>
4行目は、グラフィックライブラリNVD3でグラフを描画するのに使うsvgタグである。<div ng-app="app" ng-controller="MyController as main">
<line-chart height="250px" data="main.data"></line-chart>
<h3>Change the values: </h3>
<p ng-repeat="datum in main.data[0].values">
<input type="number" ng-model="datum.y">
</p>
</div>
angular.module('app', [])
.controller('MyController', ['$scope', function($scope) {
this.data = [{
key: 'Data',
values: [{
x: 0,
y: 0
}, {
x: 1,
y: 1
}, {
x: 2,
y: 4
}, {
x: 3,
y: 9
}, {
x: 4,
y: 16
}, {
x: 5,
y: 25
}]
}];
}]);
 |
| 図1 サンプルアプリ一覧 |
 |
| 図2 サンプルアプリインポートダイアログ |
 |
| 図3 MONACAダッシュボード |
 |
| 図4 MONACAアプリケーション図1 |
 |
| 図5 クラウドIDE図1 |
 |
| 図6 クラウドIDE図2 |
 |
| 図7 クラウドIDE図3 |
 |
| 図8 MONACAアプリケーション図2 |
 |
| 図9 MONACAアプリケーション図3 |
 |
| 図10 MONACAアプリケーション図4 |
<body>
<ons-navigator page="main.html" var="navi"></ons-navigator>
<ons-template id="main.html">
<ons-page ng-controller="CountriesController as countries">
<ons-toolbar>
<div class="center">World Population</div>
</ons-toolbar>
<div class="filter-input-container">
<input class="search-input" ng-model="query" placeholder="Filter countries" type="search" value="" />
</div>
<ons-list>
<ons-list-item modifier="chevron" ng-click="countries.showCountry(country)" ng-repeat="country in countries.list | filter:query">
{{ country }}
</ons-list-item>
</ons-list>
</ons-page>
</ons-template>
<ons-template id="country.html">
<ons-page ng-controller="CountryController as country">
<ons-toolbar>
<div class="left">
<ons-back-button>Back</ons-back-button>
</div>
<div class="center">
{{ country.name }}
</div>
</ons-toolbar>
<ons-list class="year-select-container">
<ons-list-item>
<select class="text-input text-input--transparent" ng-model="country.year" ng-options="year for year in country.years" style="margin-top: 4px; width: 100%;">
</select>
</ons-list-item>
</ons-list>
<population-chart data="country.population" ng-if="country.showChart"></population-chart>
</ons-page>
</ons-template>
</body>
angular.module('app', ['onsen'])
.controller('CountriesController', ['$scope', 'Countries', function($scope, Countries) {
var that = this;
Countries.get()
.then(
function(countries) {
that.list = countries;
}
);
this.showCountry = function(country) {
$scope.navi.pushPage('country.html', {data: {name: country}});
};
}])
.service('Countries', ['$http', function($http) {
this.get = function() {
return $http.get('countries.json')
.then(
function(response) {
return response.data.countries;
}
);
};
}])
.service('Population', ['$http', function($http) {
  this.get = function(country, year) {
    return $http.jsonp('http://api.population.io:80/1.0/population/' + year + '/' + country + '/?format=jsonp&callback=JSON_CALLBACK')
      .then(
        function(response) {
          return response.data;
        }
      );
  };
}])
MonacaはAngulaJSというJavaScriptのフレームワークを用いている。1行目はAngulaJSのモジュールを定義しているところである。モジュールはAngularJSの最も基本的な単位で、アプリを構成する様々な部品(コントローラ、サービス、ディレクティブなど)をモジュールの下に作成していく。http://api.population.io:80/1.0/population/' + year + '/' + country + '/?format=jsonp&callback=JSON_CALLBACKというURLを作成し、Webサービスを提供するサーバに人口データの要求を行っている。
http://api.population.io/1.0/population/2018/Japan?format=jsonpすると、以下の様なJSON形式の人口データが返ってくることを確認できた。
[
  {
    "females": 493727,
    "country": "Japan",
    "age": 0,
    "males": 520667,
    "year": 2018,
    "total": 1014404
  }
今回解読したソースコードをおおまかに整理すると、以下の図11のようになる。 |
| 図11 index.jsフロー図 |
 |
| 図1 MONACAダッシュボード画面 |
 |
| 図2 スマホ版MONACA図1 |
 |
| 図3 リングメニュー一覧 |
 |
| 図4 はじめてのMONACAアプリを開いた状態 |
 |
| 図5 クラウドIDEで開いた図 |
 |
| 図6 編集後のindex図 |
 |
| 図7 ボタン追加図 |
<a class="button--large" href="https://www.blogger.com/null" onclick="alert('終了します')">Stop Demo</a>
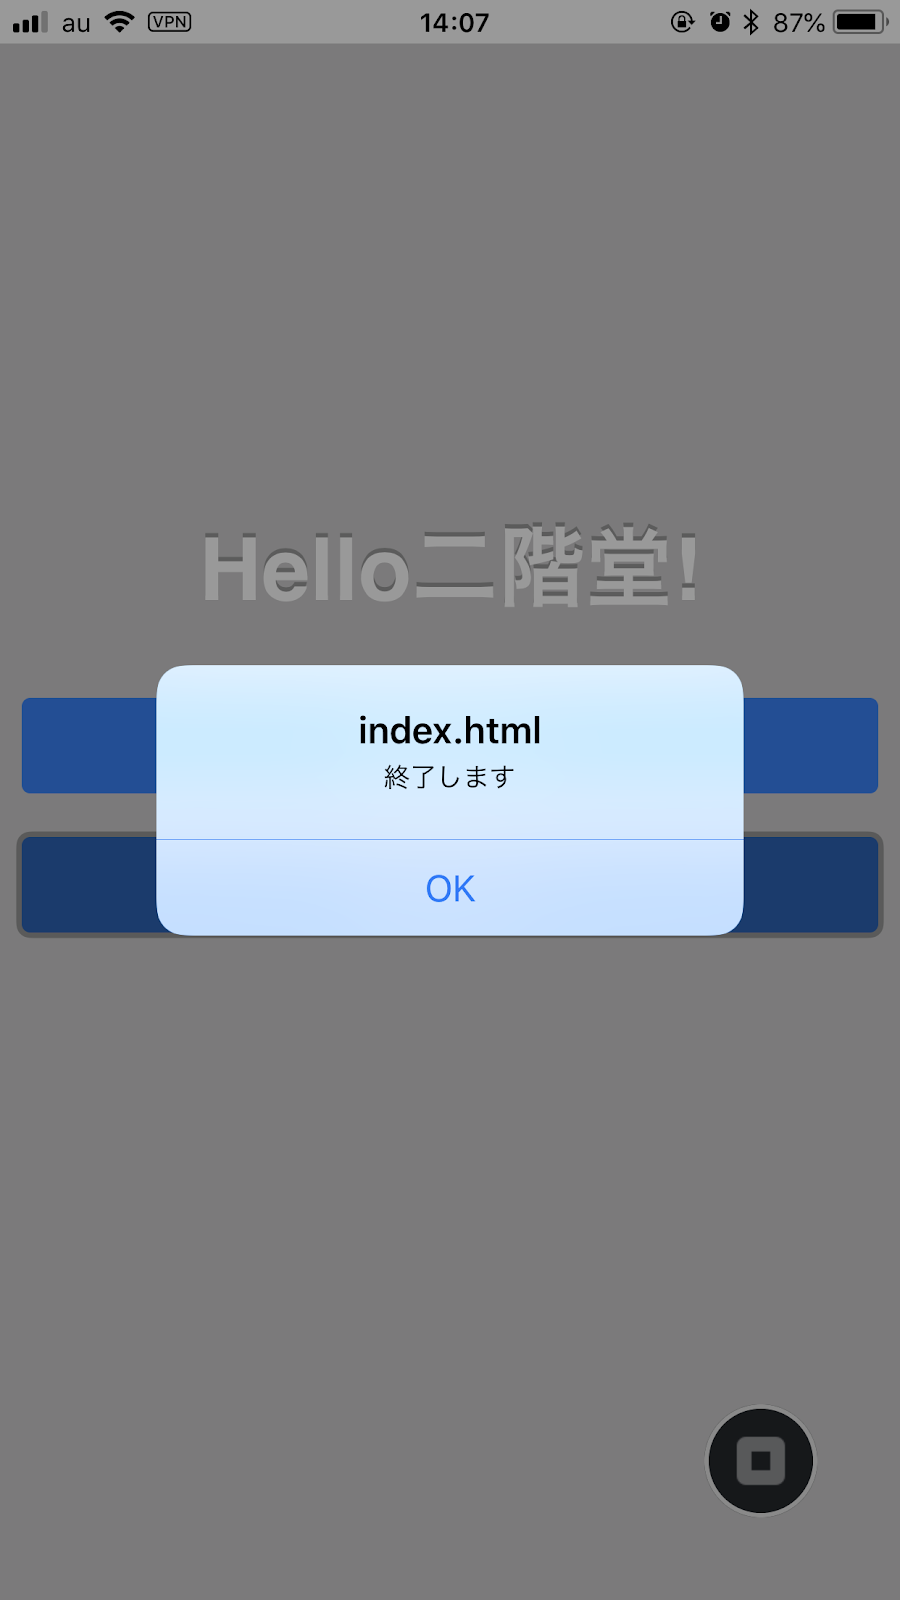 |
| 図8 Stop Demoをタップした状態 |
前回 レーダーチャートの表示を行うことが出来たので、今回は実際の値を代入したグラフの描画を試みる。 .controller('RaderChartController', ['$scope', 'Countries', funct...


